I completed the Data Analytics and Decision Making course as part of my Executive MBA. In this blog, I summarise some of the insights and learnings that you can apply in your work too.
There are may benefits of using data in the digital world. It can can enable businesses to predict customer needs based on their past behaviour and guide their product development activities. Analysing data can help organisations discover behaviour patterns that may signal dissatisfaction, allowing them to take active steps to better understand and solve the problems. This can increase customer retention. It also can make customer interactions more personalised and therefore meaningful, increasing engagement and loyalty.
There are, however, some pitfalls too. Too much personalisation can backfire, especially if there is a lack of transparency and privacy considerations while processing large amounts of data. Even if a decision is ultimately in the person’s interest, the way the aim is achieved should be considered too, not just the outcome itself.
Data can be a liability too. The more data, particularly sensitive data, an organisation collects the more risk they potentially expose themselves to. It is hard to regain customer trust after a security incident and governments around the world respond with more stringent regulation, which, in turn, comes at an increased cost to businesses.
Privacy concerns aside, not all data is relevant to the decision-making process, so collecting it ‘just in case’ can make separating what’s useful tricky. Different data types, varying quality, lack of context, potential bias and ever increasing volume amplify this issue.
This course reinforced the importance of responsible use of data and introduced concepts of descriptive, diagnostic, prescriptive and predictive analytics to drive value creation in organisations.

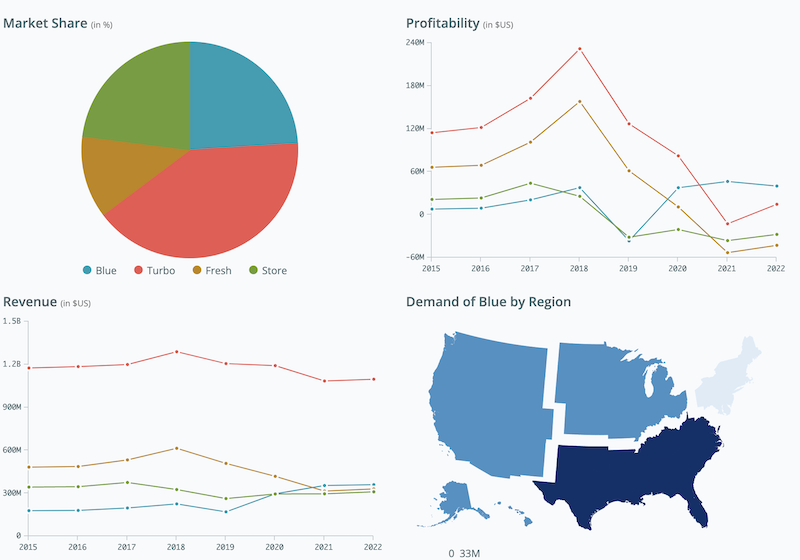
As a practical introduction, I got to play with the Data Analytics Simulation for Strategic Decision Making developed by Harvard University as part of the course. It’s an interactive case study where you make strategic decisions based on historical data to capture market share and increase profitability of a new product.

I really enjoyed exploring this simulation. A quick play with filters revealed complex relationships between income, household size, region and age for pretty much every metric. Overall, I found this simulation much more involved than initially anticipated with many interdependent parameters to analyse and tweak.
We also covered mathematical foundations of probability theory and statistics, with particular focus on standard and binomial distribution, Bayes’ Theorem, covariance and correlation and their application in finance.
I learned the fundamentals of hypothesis testing and practical application of tools such as decision trees, contingency and payoff tables in decision making.
Regression analysis was one of the foundations of the course and I completed Harvard’s Quantitative Methods module to further develop my understanding of this key concept.
I learned to perform regression analysis using Excel initially as part of the series of interactive case studies.

I then built regression models using Python. Although this course was not aiming to make me a data scientist, having a glimpse into what training a model is like, even if in a simplified way, was very valuable.

In general terms, a machine learning model predicts the dependent variable based on independent variables. It does so by training, i.e. learning the relationship between these variables based on the sample data set provided. Once trained, the model can predict the dependent variable based on new data. For example, I developed a model that can predict a house price based on the area, age and number of bedrooms.
The quality of training data is a major consideration, as the model can only make predictions based on the sample provided. If the sample is inaccurate or biased, the prediction results will be affected. Moreover, there may be other factors that influence variables in question that are not included in the model.
More data is usually preferred. However, a smaller but higher quality data set can be superior to a large number of poorly structured and irrelevant records. The ’garbage in, garbage out’ concept underscores this challenge.
Sampling method and sample size should be carefully considered when selecting training data. Samples don’t always accurately represent the population which can lead to skewed results. For example, house prices vary vastly in different cities, so if a model is trained on house prices in New York, it cannot predict house prices in Sydney.
Underfitting is another challenge, where the relationship between dependent and independent variables is oversimplified. This leads to poor model performance as underlying patterns in the data are not captured appropriately. To overcome this, multiple carefully selected variables (watching out for multicollinearity) should be used (but not too many to avoid overfitting!).
More broadly, ethical and legal aspects of analysing large amounts of data at scale should be understood. We should establish clear accountability and governance and communicate the reasons for using data in an open and transparent way. This should include explanations on how it will be stored, shared, protected and destroyed when no longer needed.
It can be useful to establish a feedback loop that allows people to review the results and continuously update the model based on these inputs. For example, ongoing monitoring for fairness with an ability to manually review and dispute the results is important.
Scaling and automating number crunching on large data sets can save time and money, it can also help minimise human error resulting from manual calculations. In some cases, it can even increase fairness and reduce bias in decision making, making it more fact-based.
This course demonstrated that one doesn’t have to be afraid of numbers and code – it’s more than possible to get a good grasp of these concepts given the foundations I developed. I now have a framework of tackling these problems and I will continue to ask better questions, ask for and challenge the underlying data and assumptions (e.g. correlation v causation) and develop probabilistic thinking.
The opportunities for ML automation in cyber security are vast. Some predictive models are already applied to prevent fraud, combat spam and detect malware.
Using such tools and models to analyse large amounts of data can help me identify patterns that a human operator could otherwise miss. Detecting anomalies that way can help spot intrusions and mitigate potential risks quickly, before they result in security breaches.
Having hands-on experience will help you better evaluate the practicality and effort required to prepare the data and build a model. This allows projects to be planned better, and for more effective communication, with both data scientists and business stakeholders. On one hand, you can manage expectations of executives when it comes to limitations of ML models and the complexity and time required to properly implement them and prepare the data. On the other hand, you can appropriately challenge technical staff based on the understanding of core concepts.
Practical experience can significantly improve your ability to collaborate with stakeholders while progressing on a path to becoming a better “translator” who can connect the worlds of business and data science.
You can use common language with data scientists, demonstrating your understanding of technical terms. This also helps develop empathy for what they have to go through when building a model. For example, I can now see the challenges related to debugging the code, selecting the right data set, cleaning and formatting the data so it’s actually useful. It can be highly frustrating, especially when the business is expecting miracles based on a bad data set, and having that perspective helps build trust with a technical team. Conversely, being able to put your executive hat on and clearly formulate the problem, while keeping limitations in mind, can greatly enhance the usefulness of the outcome provided by the data scientists. Keeping things simple and telling the story with the data, rather than just presenting raw results can make a much bigger business impact.
Although we also covered Artificial Intelligence in some detail, the course focused on translating insights gained from data analytics into decisions and actions an organisation can take to create and capture value.
Every data analytics project first starts with defining a business objective that addresses a business need. Then it’s about telling a story with data. Communication and visualisation, therefore, were key focus areas of the course.
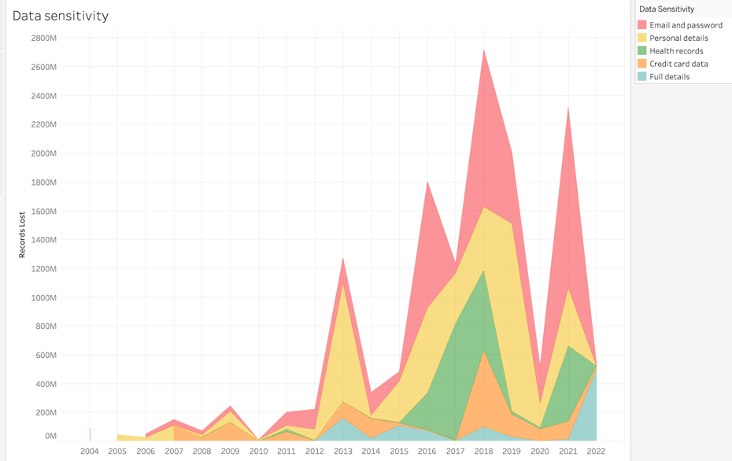
I learned the fundamentals of data visualisation and applied my knowledge when developing dashboards in Tableau for the final project. I analysed historical data breach data, including root causes and prepared a presentation to business leaders.
Business executives rarely care about the analytical process followed and all the technical work that goes into the final deliverable. At the end of the day, they only need to know the implications of the analysis to make the best decision. What action do you want our audience to take? Beginning with an end in mind is key to telling a cohesive story.

3 Comments